[:pl]
W 2013 roku polska „rodzina” lotnicza powiększyła się o 2 nowe lotniska międzynarodowe, otwarto lotnisko w Lublinie i ponownie lotnisko w Modlinie. Władze lokalne w różnych zakątkach naszego kraju myślą o utworzeniu kolejnych lotnisk międzynarodowych, takie głosy można usłyszeć w Gdyni, Kielcach, Olsztynie, Opolu, Koszalinie. Najnowszym lotniskiem, które parę dni temu zostało wpisane do rejestru lotnisk cywilnych Urzędu Lotnictwa Cywilnego jest Port Lotniczy Radom-Sadków, zlokalizowany kilka kilometrów od centrum Radomia.

Lotniska nie są tanie. Cywilny port lotniczy, żeby się utrzymać, powinien odprawiać średnio ponad 1 milion pasażerów rocznie. I tu pojawia się pytanie, jaki jest potencjał polskich lotnisk, tych działających już od lat, jak i tych, które dopiero co powstały lub w najbliższych czasie się otworzą. Niniejsza analiza traktuje o lotniskach działających oraz o lotnisku w Radomiu i Szymanach na Mazurach, które być może wkrótce ruszy.
W Polsce regularny ruch pasażerski odbywa się na 13 lotniskach międzynarodowych, najbliżej siebie położone są porty lotnicze w Warszawie i Modlinie. Blisko siebie położone są również lotniska w Poznaniu i Zielonej Górze oraz w Krakowie i Pyrzowicach. W 2013 roku najwięcej pasażerów obsłużono na lotnisku Chopina (10,7 mln pasażerów), następnie w Krakowie (3,6 mln) i Gdańsku (2,8 mln), na drugim biegunie było lotnisko w Zielonej Górze z 12 tysiącami pasażerów w całym 2013 roku.
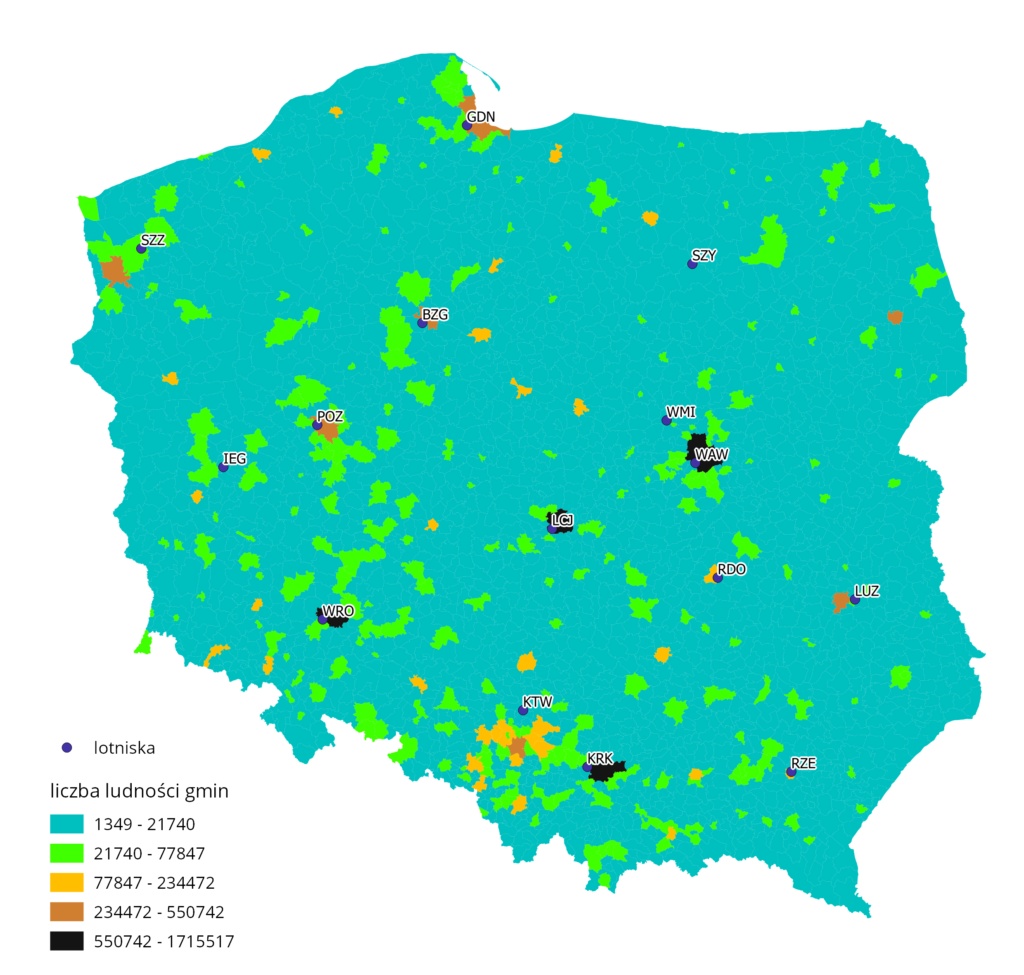
W celu zbadania potencjału portów lotniczych wyznaczono ich bufory o średnicy 20, 50 i 100 kilometrów. Następnie została obliczona liczba ludności zamieszkująca tereny wyznaczone powyższymi buforami, to pozwoli obliczyć ilość potencjalnych pasażerów każdego portu lotniczego, która może skorzystać z ich usług. Analiza pokazuje liczbę ludności danej gminy, pomijany jest tutaj sposób dotarcia potencjalnego klienta portu lotniczego, może być tak, że łatwiej dojechać do portu oddalonego dalej niż tego, który jest dużo bliżej.
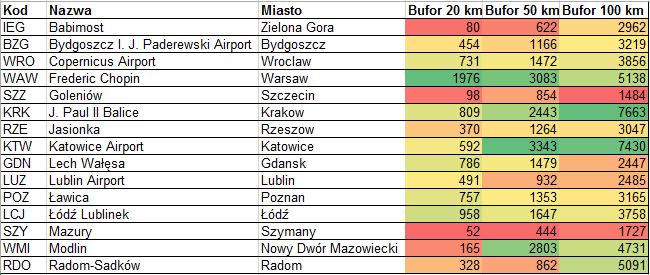
Poniżej przedstawiono tabelę z wynikiem analizy, w odległości 20 km najwięcej osób mieszka w okolicy lotniska Chopina (prawie 2 mln), na drugim miejscu jest Łódź, najmniej jest w niedziałającym jeszcze lotnisku w Szymanach (52 tys.), trochę więcej w Babimoście (80 tys.) i w Goleniowie (98 tys.). Ma to związek z tym, że lokalizacja tych ostatnich lotnisk jest poza głównym miastem.

Analizując drugi bufor sytuacja się zmienia, liderem jest tu Katowice Airport w Pyrzowicach (3,3 mln osób), nieco mniej mieszka w okolicach portów lotniczych Okęcie i Modlin. Z kolei w odległości 50 km od Szyman mieszka tylko 444 tys. osób, od Babimostu 622 tys., a od Goleniowa i Radomia niecałe 900 tys.
W promieniu 100 km od każdego z analizowanych lotnisk mieszka ponad milion mieszkańców, najwięcej jest ich w okolicach Balic i Pyrzowic (ponad 7 mln), co jest łatwe do przewidzenia, zważywszy na to, iż oba lotniska są blisko siebie. Ponad 5 milionów mieszkańców ma mniej niż 100 km do lotnisk w Warszawie, Modlinie i Radomiu. Najmniej mieszkańców jest w okolicach Goleniowa i Szymanach (1,5 i 1,7 mln).
Patrząc na mapę od razu widać, że potencjalny pasażer często jest w zasięgu co najmniej dwóch, a czasami kilku lotnisk i wtedy potencjał danego lotniska spada, z uwagi na konkurencję sąsiedniego portu. Dla pasażera bliskość kilku lotnisk jest zjawiskiem pozytywnym, może wybierać między przewoźnikami i kierunkami lotów oraz cen biletów. Zarządcy portów muszą się bardziej starać by pozyskać nowego pasażera.

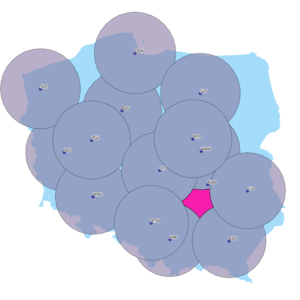
Najmniejszą polską konkurencję wśród polskich portów lotniczych wydaje się, że ma port w Gdańsku i Szczecinie, najtrudniej będzie zacząć pracę zarządowi portu w Radomiu, który ma w promieniu około 100 km porty w Lublinie, Łodzi, a przede wszystkim w Warszawie. Analizując zasięgi portów w otoczeniu lotniska w Radomiu wyliczono, że w promieniu 100 km od Radomia mieszka 609 tysięcy osób, które mają więcej niż 100 km do innych lotnisk. Pokazuje to różowy poligon na powyższej mapie zasięgów lotnisk.
Podsumowując należy bardzo dokładnie zastanowić się czy Polska potrzebuje więcej portów lotniczych. Czy nie lepiej modernizować działające lotniska i poprawiać dojazd do nich.
Najtaniej jest uczyć się od innych krajów, które popełniły błędy budując dużo niepotrzebnej infrastruktury i wydając unijne pieniądze.
Aktualizacja: Artykuł pochodzi sprzed kilku lat, potencjał ludnościowy lotnisk można badać w lepszy sposób, czyli dostępnością czasową. Artykuły na temat dostępności lotnisk znajdziecie pod tym linkiem.
[:en]Population potential of Polish airports
In 2013, Polish aviation “family” has extended by 2 new international airports with opening of the airport in Lublin and re-opening the one in Modlin. Local authorities in different parts of our country are making plans to create other international airports – in the locations like Gdynia, Kielce, Olsztyn, Opole, Koszalin. The most recent airport, which was entered into the register of civil airports a few days ago by Civil Aviation Authority, is Radom Airport, located a few kilometres from the centre of Radom.

Airports are not cheap. To be viable, a civil airport should have a traffic of more than 1 million passengers per year. And here comes the question what the potential of Polish airports is, both of those operating for years and those that have just been created or are to be opened in the nearest future. This analysis concerns the existing airports and the airport in Radom and Szymany, which may soon come into operation.
In Poland, a regular passenger traffic takes place at 13 international airports. The ones closest to each other are the airports in Warsaw and Modlin. Also, the airports in Poznań and Zielona Góra are in each other’s proximity, as well as the airports in Kraków and Pyrzowice. In 2013 the largest number of passengers flew from Warsaw Chopin Airport (10.7 million passengers), followed by Kraków (3.6 million) and Gdańsk (2.8 million), at the other extreme there was the airport in Zielona Góra with 12 thousand passengers in 2013.
In order to explore the potential of airports, their buffer zones were set with a diameter of 20, 50 and 100 kilometres. Then, the number of people living in the areas marked by the above buffers zones was calculated, which will make it possible to calculate the number of potential passengers of each airport who can avail of its services. The analysis shows the population of a given municipality; the way of reaching the airport by the potential clients is not taken into consideration – it may happen that the access to the airport located at the larger distance is better than to the one that is closer.
Below there is a table showing the analysis results. Within the distance of 20 km, the largest number of people live in the area of Warsaw Chopin Airport (nearly 2 million), followed by Łódź, the smallest population was indicated near the not yet active airport in Szymany (52 thousand), a little larger in Babimost (80 thousand) and Goleniów (98 thousand). This is due to the fact that the location of the latter airports is outside the main city.

In the analysis of the second buffer, the situation is changing. The leader is Katowice Airport in Pyrzowice (population of 3.3 million), slightly smaller number of people live in the vicinity of Warsaw Chopin Airport and Warsaw Modlin Airport. On the other hand, the area at the distance of 50 km from Szymany has the population of only 444 thousand, Babimost – 622 thousand, and Goleniów and Radom – less than 900 thousand.
The area within the radius of 100 km from each of the analysed airports has the population of over one million inhabitants, with the majority near Kraków Airport and Katowice Airport (over 7 million), which is easy to predict, given the fact that the two airports are close to each other. More than 5 million people live less than 100 km far from the airports in Warsaw, Modlin and Radom. The smallest number of people live in the area of Goleniów and Szymany (1.5 and 1.7 million).
The map clearly shows that potential passengers are often located in the area of at least two, and sometimes more, airports, which reduces the potential of a given airport due to the competition of the neighbouring airport. For a passenger, the proximity to several airports is a positive factor, as they can choose between the carriers and the directions of flights and fares. Airport managers must try harder to win new passenger.

It seems that the airports in Gdańsk and Szczecin have the lowest competition in Poland, while the authorities of Radom Airport are facing the toughest task, as in the radius of about 100 kilometres there are also ports in Lublin, Łódź, and Warsaw in particular. When analysing the impact range of the airports in the vicinity of Radom Airport, it has been calculated that 609,000 people living within 100 km from Radom are located more than 100 km far from other airports. This is indicated by the pink polygon on the map of airport impact ranges.
To sum up, it should be very carefully considered whether Poland needs more airports. It could be a better idea to modernise and improve the existing airports and access to them.
The cheapest way is to learn from other countries that have made a lot of mistakes by building unnecessary infrastructure and spending EU money.
[:]